Handicap Tools and Table Generation

The UK archery handicap system is one of the most underrated assets we have in this country. It provides a mathematically rigorous way of quantifying accuracy in archery, and then uses that to calculated expected scores on different rounds for that level of accuracy. The system was originally devise by the late David Lane, and has stood the test of time for over 4 decades now.

In 2023, the algorithm was tweaked slightly to more accurately reflect the performance of modern archery equipment, but the fundamentals remain the same. Jack at archerycalcualtor.co.uk will be writing more on the mathematics behind the new system soon, so I won’t steal his thunder by covering that here. Instead, I’ll focus on some of the practical tools you’ll find on this site for dealing with handicaps.

The first an most obvious thing related to handicaps are the handicap tables. These allow you to do two things

  • For a given score, look up what the handicap of that score is (if the exact score isn’t shown, you take the next handicap above it).
  • For a given handicap, look up what score might be expected for that round. For example, if your handicap is 13 (which is extremely good), you might expect to score 1226 on a York round, 1339 on a 90m 1440, or an enormous 1435 on a Metric 4.
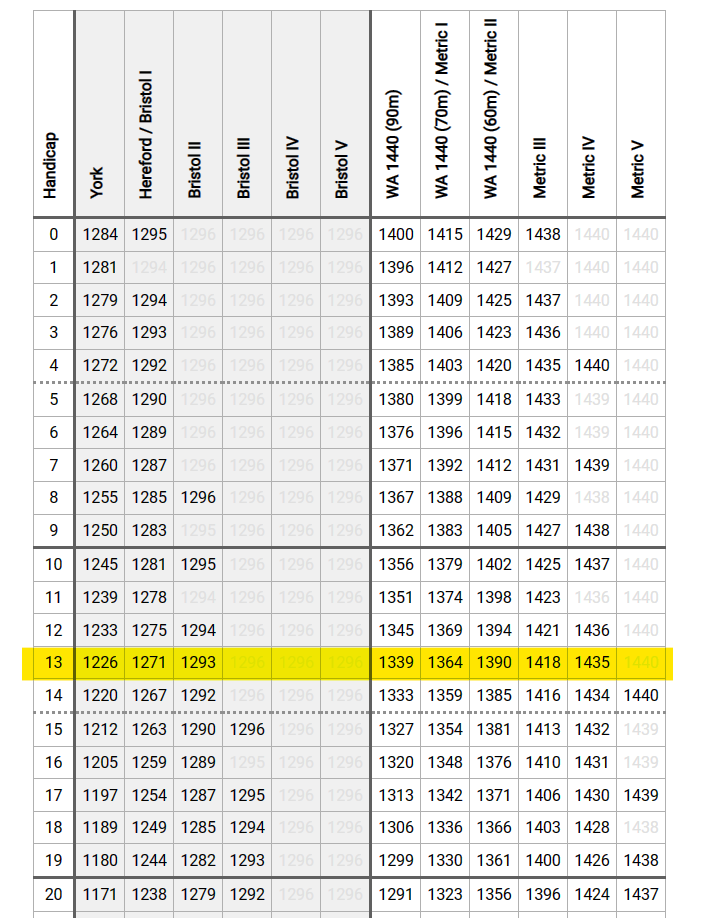
Looking across a handicap table shows what scores you might expect on different rounds.

The official handicap tables can be downloaded from ArcheryGB, but if you want a more customised version, you can create one on this site using this table generator which can also be found at the bottom of this page.

Handicaps for Analysis and Comparison

Looking across the handicap tables to find expected scores on other rounds is a bit laborious. On our Handicap Tools page, you’ll find a tool specifically designed for this task.

This can be really useful if you’re shooting a new round for the first time, or if you’re trying to set selection scores for teams and want to ensure that the same level of performance is involved in both e.g. “You qualify to join the squad if your have scored 609 on a WA 60m or 577 on a WA 70m

Handicap Tables for Custom Rounds

The mathematics of the handicap system is not limited to our standard rounds. We can easily calculate a handicap table for a complete made-up combination of arrows, distances and face sizes. On our Handicap Tools page, you can do exactly this.

Imagine you’re practising at your club, and because of the availability of targets, you end up shooting some weird combinations. Let’s say you shoot 2 dozen arrows at 60m on an 80cm target face, and then 30 dozen at 70m on a full-size face. Let’s say you score 460 points doing this, and your normal handicap is 30. Is this a good or bad score? This tool allows you to answer exactly this, and we see that in this case 460 on that custom round is a handicap of 35, which is worse than you would have hoped. Further down the page, we can generate a full handicap table for this custom round, and we can see that with a handicap of 30, we would have expected to score 486 points on that round, which gives us an idea of how far off we are.

Group Size Calculations

As I mentioned at the start, handicaps are really just a way of calculating group sizes, and we can expose those underlying calculations in some interesting ways. Also on the Handicap Tools page, you’ll find these two calculators at the bottom, which let you calculate group size comparisons, and group sizes for a given handicap.

Custom Handicap Table Generator

This tool, also available on our dedicated handicap table generator page, allows you to generate custom handicap tables for your favourite set of rounds, with customisable precision and range. You can also download the results as a CSV for use in spreadsheets if you prefer.

Rounds
York;  Hereford / Bristol I;  Bristol II;  Bristol III;  Bristol IV;  Bristol V
St. George;  Albion / Long Windsor;  Windsor;  Windsor 50;  Windsor 40;  Windsor 30
New Western;  Long Western;  Western;  Western 50;  Western 40;  Western 30
American;  St. Nicholas
New National;  Long National;  National;  National 50;  National 40;  National 30
New Warwick;  Long Warwick;  Warwick;  Warwick 50;  Warwick 40;  Warwick 30
WA 1440 (90m);  WA 1440 (70m) / Metric I;  WA 1440 (60m) / Metric II;  Metric III;  Metric IV;  Metric V
Long Metric (Men);  Long Metric (Women) / Long Metric I;  Long Metric II;  Long Metric III;  Long Metric IV;  Long Metric V
Short Metric I;  Short Metric II;  Short Metric III;  Short Metric IV;  Short Metric V
WA Standard Bow
WA 900
WA 70m;  WA 60m;  WA 50m (Barebow) / Metric 122-50;  Metric 122-40;  Metric 122-30
WA 50m (Compound);  Metric 80-40;  Metric 80-30
Bray I;  Bray II;  Stafford;  Portsmouth;  Portsmouth (Triple Face);  Portsmouth Compound;  Portsmouth (Triple Face) Compound;  Bray I Compound;  Bray II Compound;  Stafford Compound;  Worcester;  Worcester 5-Spot;  Vegas (Triple Face);  Vegas (Triple Face) Compound;  Vegas300 (Full Face);  Vegas300 (Triple Face);  Vegas300 (Full Face) Compound;  Vegas300 (Triple Face) Compound
WA 18m;  WA 25m;  WA Combined;  WA 18m (Triple Face);  WA 25m (Triple Face);  WA Combined (Triple Face);  WA 18m Compound;  WA 25m Compound;  WA Combined Compound;  WA 18m (Triple Face) Compound;  WA 25m (Triple Face) Compound;  WA Combined (Triple Face) Compound
90m distance (122cm face) ;  70m distance (122cm face) ;  60m distance (122cm face) ;  50m distance (122cm face) ;  50m distance (80cm face) ;  40m distance (122cm face) ;  40m distance (80cm face) ;  30m distance (122cm face) ;  30m distance (80cm face) ;  20m distance (122cm face) ;  20m distance (80cm face) ;  15m distance (122cm face) ;  15m distance (80cm face) ;  10m distance (122cm face) ;  10m distance (80cm face)
2 dozen 5-zone scoring at 100 yards ;  2 dozen 5-zone scoring at 80 yards ;  2 dozen 5-zone scoring at 60 yards ;  2 dozen 5-zone scoring at 50 yards ;  2 dozen 5-zone scoring at 40 yards ;  2 dozen 5-zone scoring at 30 yards ;  2 dozen 5-zone scoring at 20 yards ;  2 dozen 5-zone scoring at 15 yards ;  2 dozen 5-zone scoring at 10 yards

Note: 2 and 3 dozen scores are not permitted for setting handicaps, although tradition dictates they can be used to assign handicaps to archers in a handicap shoot who do not have a current handicap

Precision
Handicap tables are normally shown in single handicap-point steps from 0-150, but some cases, higher precision is useful. For example, when comparing scores between rounds one handicap point might cover a wide range of scores, so a higher precision table makes for a more accurate comparison. This tool allows you to create tables at fractions of a step, from a half down to a sixteenth of a point. Caution - a 1/16th step table will have nearly 2,500 rows!

Range

Handicap tables are normally shown from 0-150, but in some cases it case be useful to look beyond that range. Top-class compound archers often shoot in the negative handicap ranges, and a negative table can aid analysis there.


Type of Table


Output


Posted

in

, ,

by

Comments

4 responses to “Handicap Tools and Table Generation”

  1. Ian Print avatar
    Ian Print

    Hi, Either there’s something strange going on or I am doing something very wrong. But I get different results from the /www.archerygeekery.co.uk/hc/calculator.php page to that on https://archerygeekery.co.uk/hc/hc.php
    For Longbow Senior Men on a WA70m round the first says a score of 32 gives A3 classification (which agrees with Archery GB tables). But the second page, in the “Generate Handicap Tables” section says the score needed is 50.

    1. Chief Geek avatar
      Chief Geek

      Oops, my mistake. Thanks for spotting the bug. The calculator was correct.

      That was just some sloppy coding on my part where it was showing you an old version of the classification config from one of the 16 million versions we tried before settling on the final ones now shown in the tables. Should all be fixed now.

  2. Rob avatar
    Rob

    Is there any chance you could provide the equations or algorithm for calculating a handicap from a score? The output from your tools suggest this is not simply table interpolation, perhaps a regression or numerical method?

    1. Chief Geek avatar
      Chief Geek

      Yes, I’m happy too. I’ll be publishing an article and some code on this soon.

Leave a Reply

Your email address will not be published. Required fields are marked *